How to use
247MarketNews Pro.
From first install to reading FlowBar states, acting on MoBot Patterns and Top Picks, and competing on the paper-trading leaderboard. Every feature, explained.
Zero to live charts in five minutes.
Download, sign up, build a watchlist, and place your first paper trade — no credit card, no trial clock.
1Download & install
Grab the installer from the download section on the home page — Windows .exe, macOS .dmg, or Ubuntu/Linux .deb (plus a portable .AppImage for other distros). All of them auto-update; the Windows and macOS builds are signed, and Linux updates are SHA-256 verified. There's also an iPhone app on the App Store that shares the same account and paper desk (watchlists are stored per device).
2Create a free account
Launch the app and register with your email and a password (minimum 8 characters). You'll be signed in instantly. Free accounts get the full desk — every page and tool in this guide, with quota caps on the social layer (5 custom alert rules, 2 friend lists, 50 DMs/day) that Pro and Elite raise.
3Add tickers
Click + Add ticker in the sidebar watchlist. Type SPY, NVDA, or BTC — stocks, OTC pinks, and crypto all work. Add 5–10 symbols you actually care about.
4Open Charts
Click any ticker in your watchlist. The candlestick chart, FlowBar momentum engine, and order book all light up. This is your trading cockpit — covered in depth in § 03.
5Place a paper trade
Open the Paper Desk page from the sidebar. You start with a $100,000 virtual balance against live prices. Open a position, set a stop, and watch the equity curve — zero risk.
BTC to your watchlist, click it, and watch the FlowBar in real time. You'll see exactly why this tool exists within 30 seconds.Folders, drag-reorder, OTC & crypto.
The sidebar watchlist is the entry point to everything. Here's how to organize it like a pro.
1Adding tickers
At the bottom of the watchlist, click + Add ticker and start typing. Search covers stocks (AAPL, NVDA, TSLA), OTC pinks (KBLB, TGNT — purple OTC pill), and crypto (BTC, ETH, SOL — green CRYPTO pill). Click any result to add it.
2Folders & drag-to-reorder
Click + Folder at the top of the watchlist to create a named folder like "Tech", "Crypto Majors", or "Earnings This Week". Drag tickers into folders, drag to reorder, or drag a folder-ticker back out to the root. Folders are one level deep — they hold tickers, not other folders. Each folder collapses with the chevron and remembers its state across restarts.
Double-click a folder name to rename it. Right-click a folder to delete it — deleted folders merge their tickers back into the root, so you never lose a symbol.
3OTC & sub-penny pricing
Prices below $1 automatically switch to 4-decimal formatting ($0.1313), and prices below $0.01 render with 6 decimals ($0.001823) — so a 50% intraday move on a sub-penny name is actually visible instead of rendering as "$0.00".
4Sparklines & removing
Every row has a tiny pixel-dot sparkline showing the last 24 hours of hourly closes — green when today is up, red when down, slate when flat. To remove a ticker, right-click the row and choose Remove. Re-add anytime via search.
FlowBar, candles, order book, pressure & depth.
The Charts page (Ctrl+3) is where you'll spend most of your time. Layout: Watchlist → FlowBar → Chart → Tab Strip → Order Book panel.
The full desk: FlowBar on top, candles + pressure gauge + order book below.
1Timeframes & tabs
Timeframe buttons above the chart: 1m (default), 5m, 15m, 30m, 1H, 1D, 1W, 1M. Below the chart, eight tabs (crypto symbols show four: Chart, Depth, Trades, Comments):
- Chart — the default candle view with MA 5 / 10 / 30 / 60 moving-average overlays.
- Depth — Coinbase-style mountain depth chart (crypto only — see below).
- Company Info — sector, industry, market cap, shares outstanding, float, description.
- Financials — income statement, balance sheet, and cash flow from quarterly and annual filings (stocks only).
- Short — short interest %, days to cover, shares short, settlement date, short volume history (stocks only).
- News — every article mentioning this symbol, newest first.
- Trades — the full rolling trade tape.
- Comments — the live community thread for this symbol (see § 11).
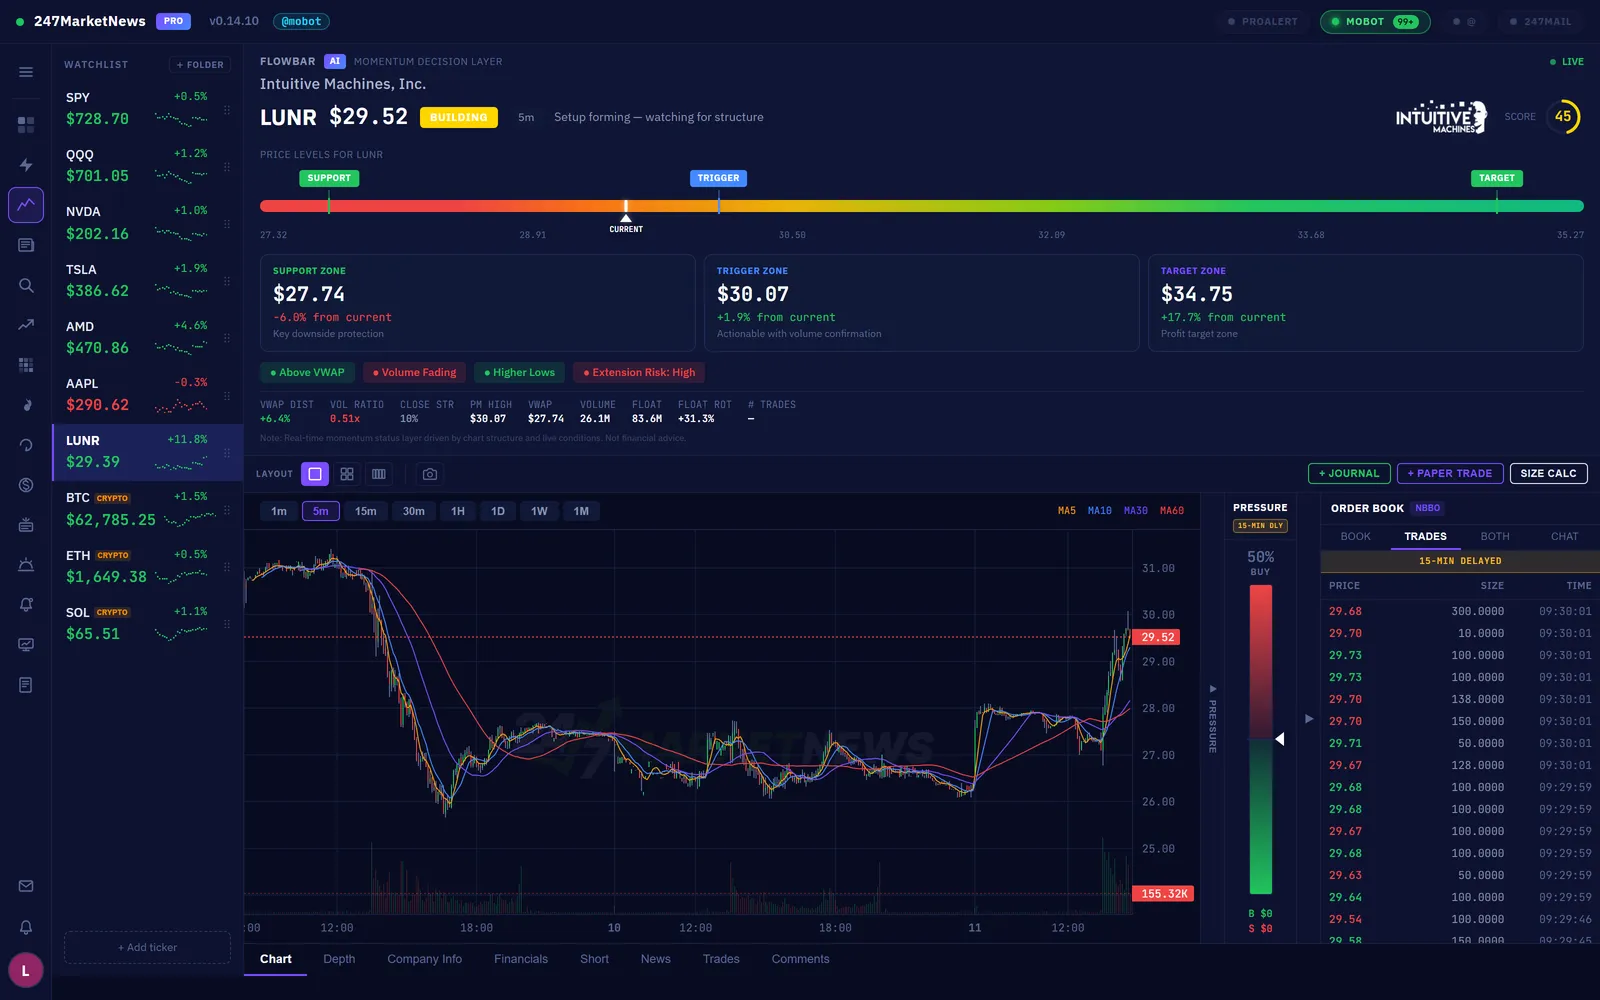
2FlowBar — the 5-state momentum engine
FlowBar sits above every chart and fuses VWAP, volume, and price action into a single 0–100 score driven by a live state machine:
- BUILDING — volume accumulating, score rising, not yet triggered. Watch, don't touch.
- TRIGGER — price just broke the trigger level with volume confirmation. The entry zone for aggressive traders.
- CONFIRMED — the breakout is holding, momentum validated. Enter here if you're patient.
- EXTENDED — price has run far past trigger; risk-reward is compressed. Tighten stops, don't chase.
- FAILING — momentum is breaking down, score dropping fast. Exit or get stopped out.
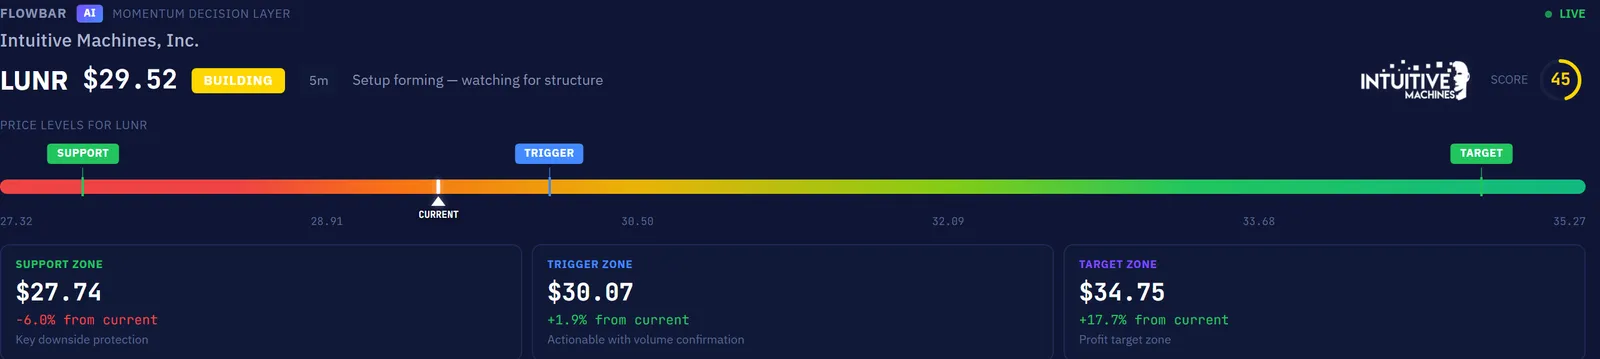
The FlowBar band: support on the left, target on the right, trigger in between — the white marker is the live price.
Below the score sits a color-graded price bar (red → amber → yellow → lime → green) with a gliding white triangle marking the current price between auto-computed Support, Trigger, and Target zones. Stocks anchor to the pre-market high and prev-day close; crypto anchors to the 24H high (crypto has no "open"). The scoring logic is identical across both markets.
Click the ⚙️ gear in the FlowBar header to tune it — five tabs: Scoring (signal weights), Penalties (deductions for selling pressure, VWAP rejection), Thresholds, Score Bands (the state cutoffs), and Timing (state persistence, dampens noise). Every value persists across restarts.
3Order Book — reading L2
For crypto, the order book shows real Coinbase L2 depth — 15 bid levels (green) and 15 ask levels (red) with cumulative depth bars painted behind each row so you can spot the "walls" instantly. A grouping dropdown (0.01 / 0.05 / 0.1 / 0.5 / 1 / 2.5 / 5 / 10) re-buckets the levels; the default is picked from the coin's price (BTC starts at $10, ETH at $1, SOL at $0.10).
For stocks, the panel shows the NBBO best bid/ask polled once per second, with a yellow 15-MIN DELAYED badge — stock tick data (quotes + individual trades) is delayed 15 minutes on the current data plan. Per-minute candles, snapshots, FlowBar, and scanners are real-time.
4Depth Chart & Pressure Gauge
The Depth tab renders the full mountain chart — green stepped bids on the left, red asks on the right, hover tooltip snapping to every level. Scroll the mouse wheel over it to zoom through the 8 grouping buckets. Crypto only — stocks show a placeholder since real-time L2 isn't available for equities.
Between the chart and the order book sits the Pressure Gauge — buy vs sell trade flow over a rolling 60-second window. 72% BUY means aggressive buyers dominated the last minute; the B $1.2M / S $845K readout shows actual dollar volume per side. Crypto uses Coinbase's tagged trade side; stocks use the tick rule (uptick = buy, downtick = sell).
Four setups, one glance.
Click the layout switcher in the top-right of the chart to cycle between Single, 2×2 grid, and 1×4 row.
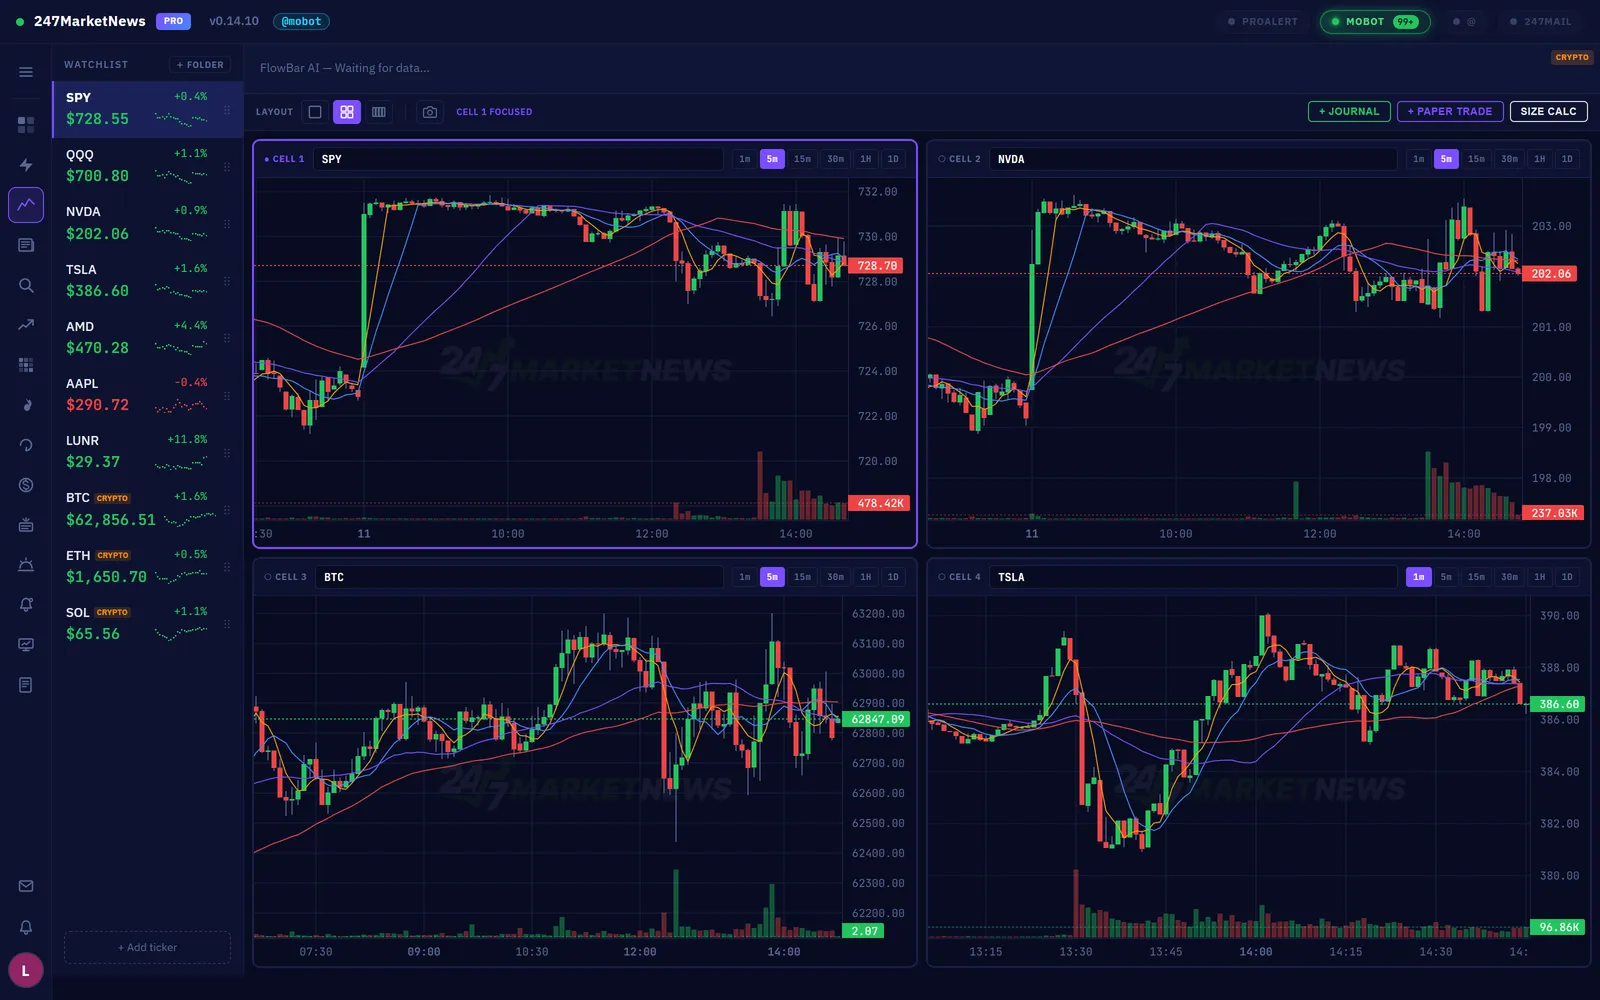
Each cell has its own independent ticker and timeframe — click into a cell, then pick a symbol from the watchlist. Stocks and crypto can sit side by side in the same grid.
Not just that it's moving — why.
Press Ctrl+2 to open the live alert feed. Seven tabs across the top: Top Picks · Patterns · All Alerts · Price · Volume · VWAP · Moonshot. You can set which tab opens by default (Top Picks out of the box).
Every row carries heat icons, session pills, sparklines, and the signal strip.
1Reading a row
- 🔥 Heat icons — alerts with converging signals get a pulsing flame: 🔥 = HOT, 🔥🔥 = ON FIRE (composite of recent change %, repeat hits, multi-channel convergence, fresh news — exact formula in the FAQ).
- 🚀 / 💥 velocity tags — 5-minute velocity detection marks moonshots and crashes the moment momentum flips. The Moonshot tab filters to them.
- Session pills — Pre-Market / After-Hours markers under the symbol; filter the whole feed by session with one click.
- Pixel-dot sparklines — the last 24h of hourly closes, right in the CHANGE column.
- The signal strip — up to 4 badges per row with a
+Noverflow pill. Click any row for the full drill-down.
2The 17 "why is this trading?" signals
Every row is scored against 17 indicators, color-coded by family — green = bullish (brighter = stronger), cyan = float, yellow = caution, red = danger, purple = info, gold = achievement:
3The drill-down modal
Click any alert row to open the full picture: a snapshot strip (price / change / volume / day range), every triggered signal with its full explanation, the float section (free float, % of outstanding, shares rotated today), short interest (shares short, % of float, days to cover), and up to 5 recent news articles — each opens in your default browser.
4Notifications & sound
Press Ctrl+Shift+N (or Tools → Notification Settings) to control toast alerts, per-type sound chimes, minimum change %, minimum hit count, per-type filters, and the poll interval. A test button fires a sample alert so you can verify without waiting for a real one.
The three tabs that do the filtering for you.
MoBot's intelligence layer: a qualifier that distills the tape, a pattern engine that names the setup, and an AI reporter that writes the recap.
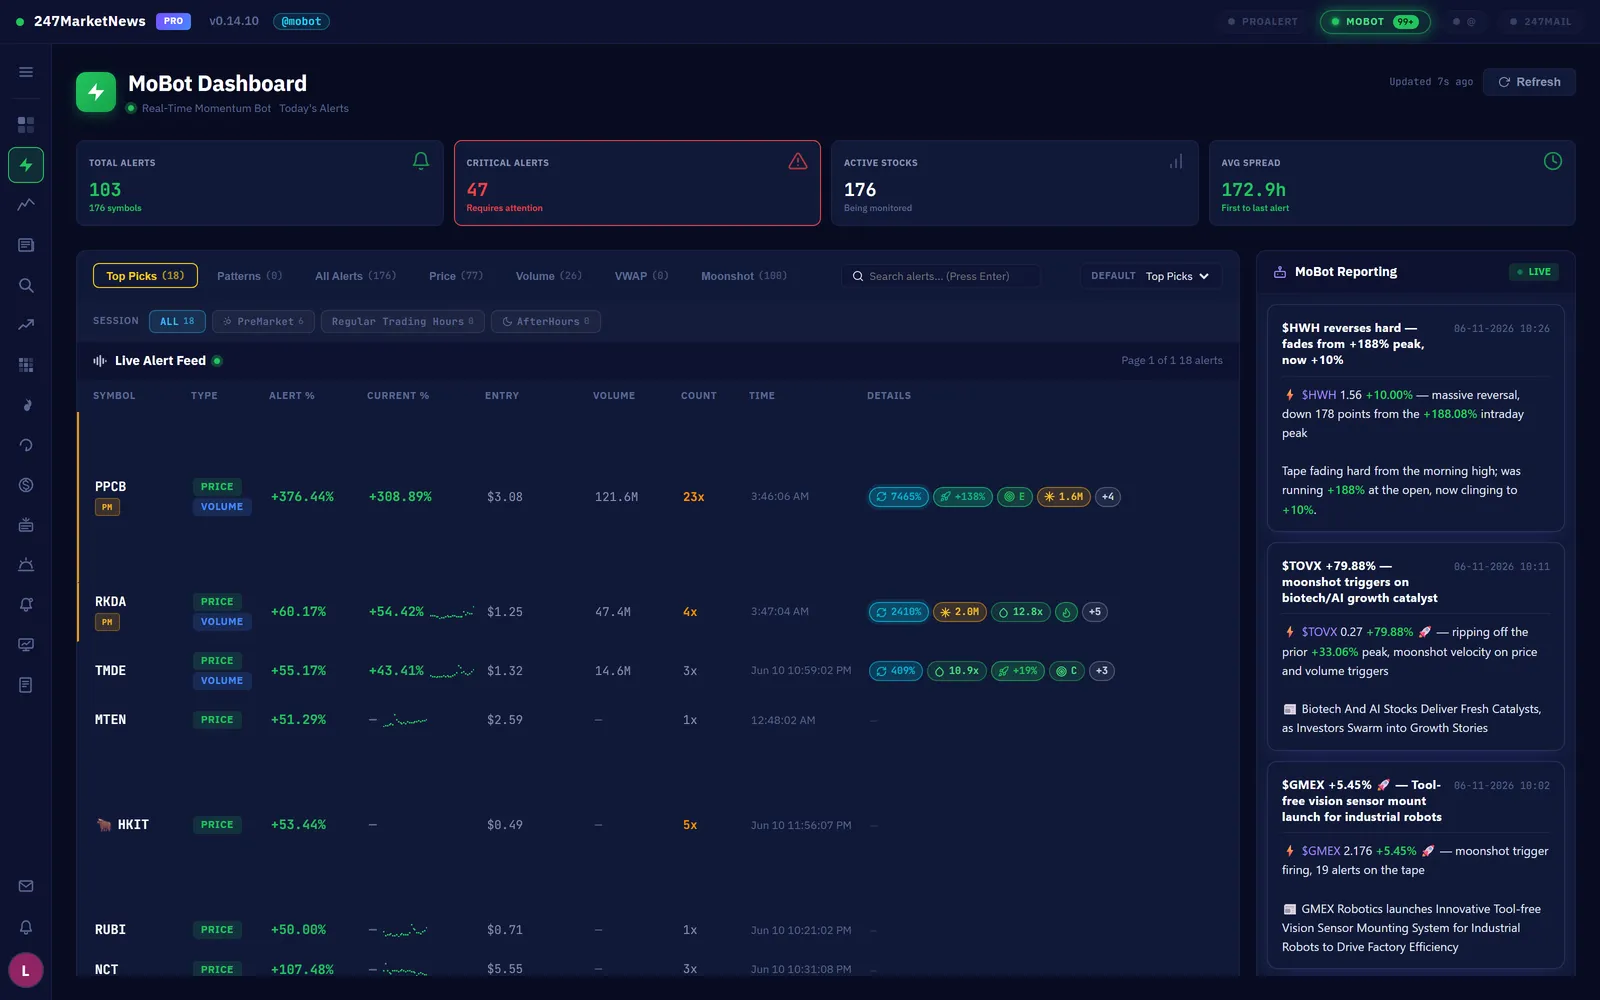
1Top Picks — 100 alerts in, 10 runners out
The Top Picks tab (the default) filters the whole alert tape down to the handful you can actually trade — qualified by move size, multi-channel confirmation (the same symbol hit by price + volume + VWAP alerts), dollar liquidity, and true float rotation.
- Qualified 24/7, server-side — picks are captured the moment they pass, even if nobody has the dashboard open. You never miss a 6 AM qualifier.
- Sticky all day, on every device — once a symbol makes the list it stays visible for the session.
- Status flags — picks still passing show as live; cooled-off picks fade; and 💀 marks the ones that crashed hard off their peak so you never chase a corpse.
- How to act — treat a fresh pick as a candidate, not a buy signal: open its chart, check the FlowBar state, and read its signal strip before doing anything.
2MoBot Patterns — seven classic setups, called live
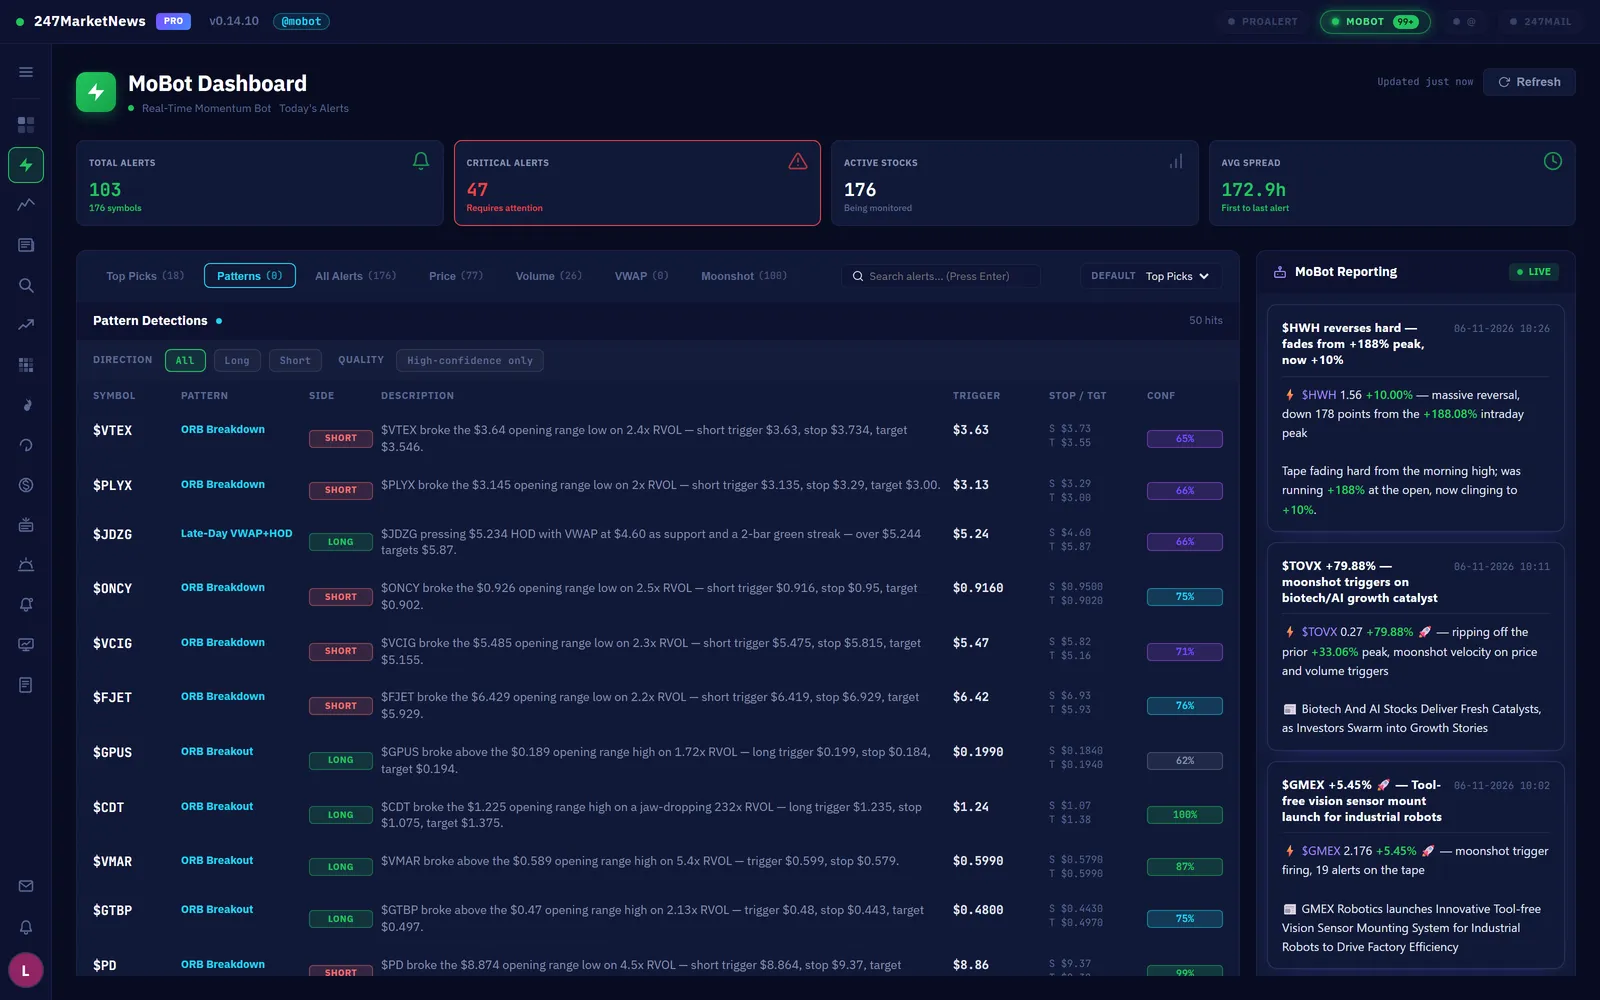
The Patterns tab runs seven day-trade pattern detectors server-side every 30 seconds, 4 AM to 8 PM ET: Bull Flag, Gap & Go, Dip & Rip, Opening-Range Breakout, VWAP Bounce, ABCD, and the Power-Hour push.
- An AI-written read on every hit — what the setup is, the trigger, the stop, and the target, in plain English.
- Scoped to what's in play — detectors only scan symbols MoBot alerted in the last few hours, not the whole junk pile.
- The 🐂 moment — when a pattern prints on a symbol you're watching, the dashboard tags it and the bull roars.
- How to act — the write-up hands you a trade plan skeleton. Verify the levels on the chart, size with the Position Sizer (
Ctrl+Shift+P), and respect the stated stop.
3MoBot Reporting — an AI reporter that never leaves the desk
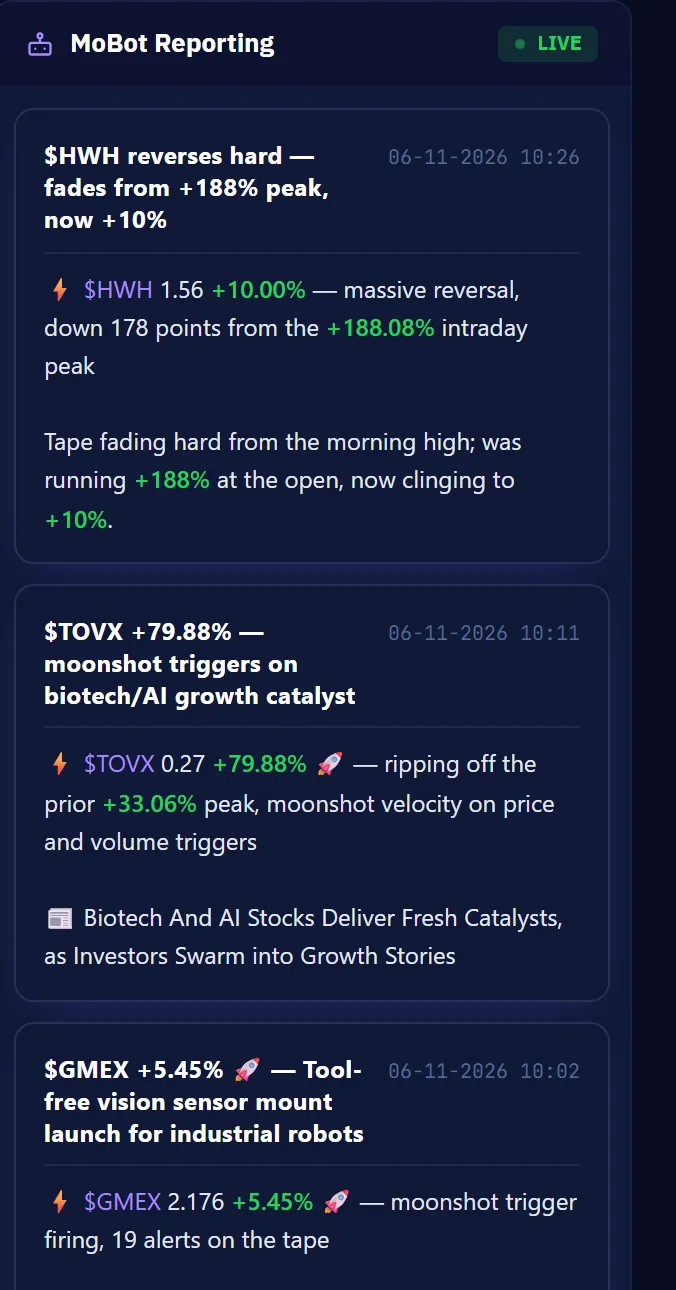
Hourly digests of the tape from the 4 AM pre-market through the close — major movers, modest movers, and the new names on the radar, rewritten fresh every hour from live market data, never speculation. The digest lives right beside the live feed on the dashboard, and on the desktop app you can pop it out into its own window.
- News-runner write-ups — the minute a headline hits a stock that's already running, MoBot writes it up and links the story.
- Reversal warnings — when a leader rolls over hard off its peak, you get the warning shot, not the postmortem.
- How to act — use the digest as your hourly context refresh: it tells you which names from earlier are still working and which already rolled.
Find the move before it happens.
Eight purpose-built boards, each answering one question about the market right now.
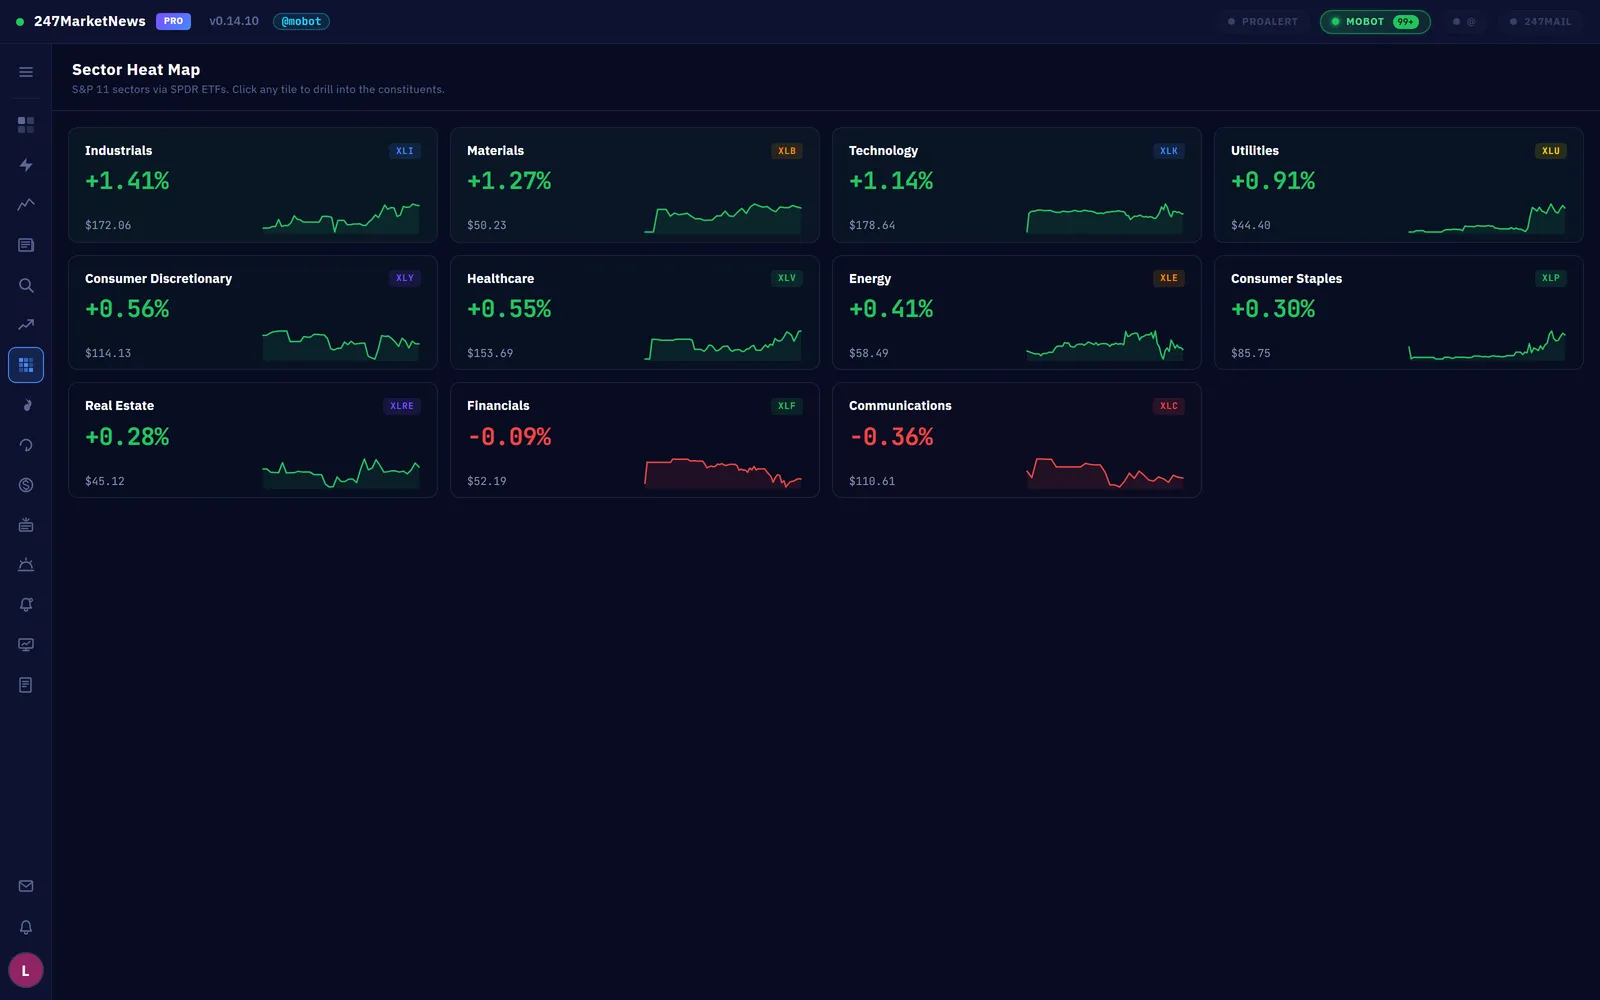
The Sector Heat Map — where the money is flowing today.
- Top Movers — gainers and losers sorted by dollar volume (not just % move), so you never waste time on zero-liquidity names. Stocks and OTC pinks included.
- Sector Heat Map — all 11 S&P sectors with live intraday sparklines; click any tile to drill into its constituents.
- Squeeze Board — stocks with short interest above 25% of float that are green on the day, sorted by today's % gain. The most feared setup in modern day trading.
- Float Rotation — names whose intraday volume has turned over the entire float, sorted by rotation ratio. Rotation above 2× usually means a real runner.
- Pre-Market (4:00–9:30 AM ET) — the biggest gap-ups and gap-downs vs prev-day close.
- After-Hours (4:00–8:00 PM ET) — post-market movers driven by earnings, guidance, and press releases.
- Crypto Markets — 385+ Coinbase USD pairs with sortable price / 24H change / volume columns and category tabs (Layer 1, DeFi, Memes, AI, Gaming, Stablecoins). Crypto trades 24/7, so this board never sleeps.
- Query Builder — build your own scan: market type (stocks / OTC / both), price range, % change range, minimum volume, minimum RVOL, sector, float size, and minimum short interest %.
The fire hose, filtered.
Press Ctrl+4 for the News Dashboard — curated coverage, the full press-release wire, SEC filings, and FDA catalysts.
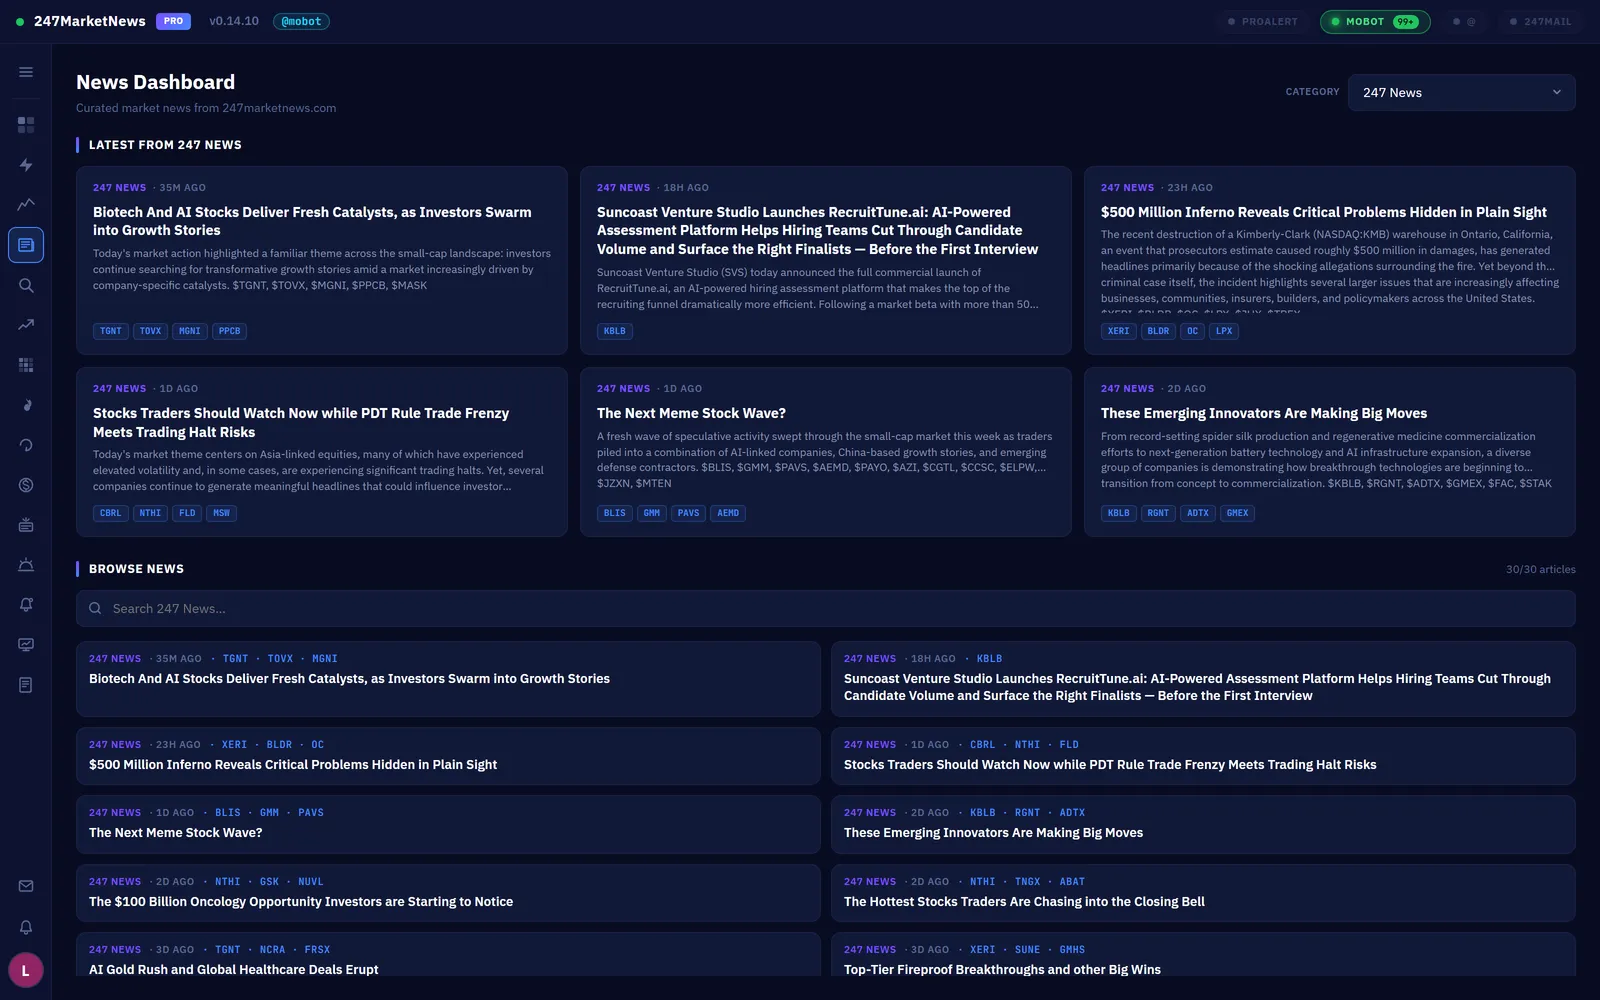
- Hero rail — the latest curated "247 News" articles up top.
- Search + categories — full-text search across seven feeds: 247 News, 247 Articles, 247 MoBot Recap Highlights, 247 All Press Releases, 247 Under $15 Press Releases, 247 SEC, and 247 FDA.
- MoBot Alerted News — the symbols from your recent MoBot alerts matched to their latest articles, so "here's what's moving" and "here's the story behind it" live in one view.
Article cards show symbol pills (like NASDAQ:NVDA), excerpt, and publish time; clicking opens the full story in your default browser. On any chart, the News, Short, and Company tabs cover the same ground per-ticker — you rarely need to leave the app to look up fundamentals.
Practice with live data. Compete on a real board.
Four tools forming a complete plan → execute → review loop: Paper Desk, Leaderboard, Trade Journal, and the Position Sizer.
1Paper Desk
A $100,000 virtual balance against live prices. Open long or short, set stop + target levels, and watch P&L update tick by tick — when price hits your stop or target, the position auto-closes and the equity curve updates. The MAX button on the order ticket instantly fills the largest size your cash supports. Reset the balance anytime from the settings gear (optionally keeping your earned badges).
2Leaderboard
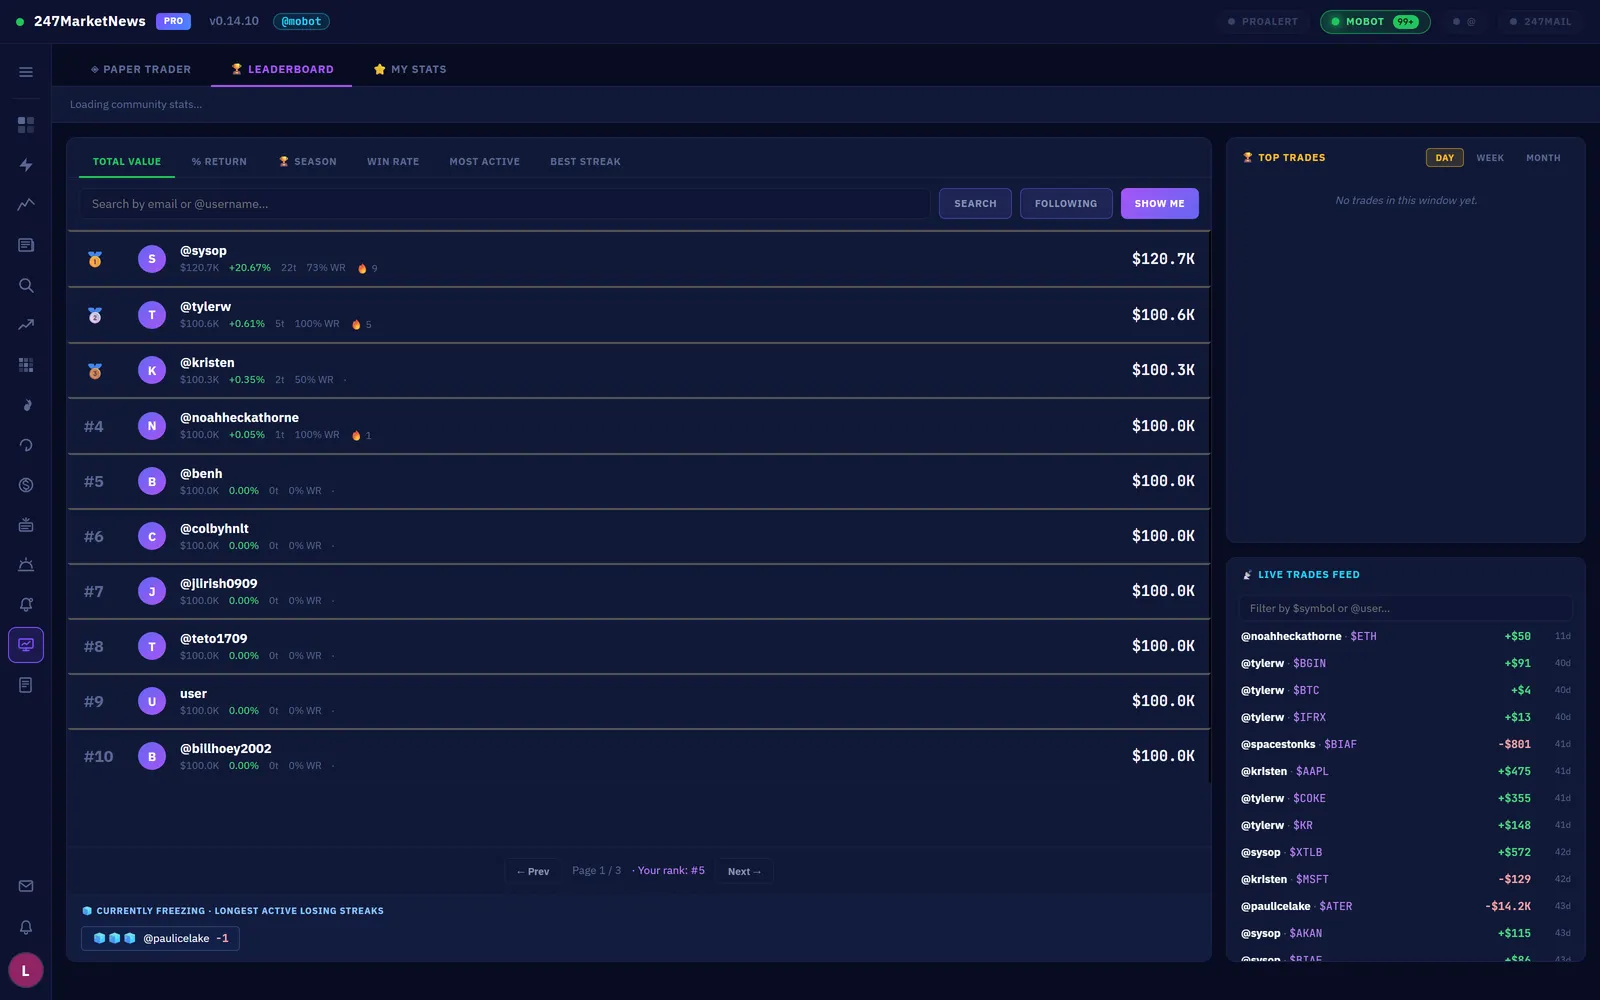
Every closed paper trade counts toward six live boards — Total Value, % Return, 🏆 Season, Win Rate, Most Active, and Best Streak. Earn badges for milestones, follow traders you respect, and comment on their closed trades. Anti-cheat is server-side: micro-size spam, wash trading, and split-second flips are detected and invalidated, so the ranking is one you can actually trust.
3Trade Journal
Log the trades you actually took: symbol, side, entry/exit, P&L, tags, notes, screenshot URL, and even the emotion. The stats header tracks win rate, profit factor, expectancy, and average hold time — drill into any tag to learn which setups actually pay you. Full CSV import and export.
4Position Sizer
Press Ctrl+Shift+P anywhere in the app. Enter account size, risk % per trade, entry, and stop — it returns share count, position value, dollar risk, and the R-multiple to your target. Consistent sizing is the #1 skill separating profitable traders from everyone else.
Build your own rules.
Unlike MoBot alerts (curated, broadcast to everyone), Custom Alerts on the Alerts page are yours alone — they persist across restarts and fire OS-level desktop notifications.
1The seven trigger types
- Price crosses level — "tell me when BTC crosses $72,000" (above or below)
- % change — "tell me when NVDA moves more than 3% in a session"
- Volume spike — "tell me when AAPL volume exceeds 2× its 30-day average"
- RVOL threshold — "tell me when any watchlist symbol hits RVOL ≥ 5"
- News published — "tell me when an article mentions TSLA"
- SEC filing — "tell me when MSFT files an 8-K"
- FDA action — "tell me on any FDA catalyst for MRNA"
2Creating, firing, and history
Click + New Rule, pick a type and a symbol (or your whole watchlist), set the threshold, save. Rules run in the background no matter which page you're on. Every fire creates an in-app toast plus (if enabled) an OS notification that persists in the Windows Action Center — click it to jump straight to the chart. Each fire is logged to a rolling history with timestamp and trigger value, so you can audit whether your rules catch what you meant them to. Per-rule mute when you need silence.
247 Desk, ticker chat, human moderators.
The social layer: private trader-to-trader messaging, real-time per-ticker comment threads, and a community that polices itself.
1247 Desk — private messages & friend lists
The 247 Desk is your private messaging center, with three views: Inbox · Sent · Friend Lists. Compose direct messages to other traders — bodies support the same $TICKER, bold, strike, and spoiler formatting as ticker comments — and build friend lists to reach a group at once (list count and size scale with your tier). The community-wide trade stream lives on the Paper Desk leaderboard: a rolling feed of the latest 30 paper trades across the community, filterable by $symbol or @user.
2Live ticker comments
Every ticker has a real-time Comments thread. @username mentions notify the mentioned user via a bell badge in the top bar. Moderators can pin the comment everyone should read first. The flag icon reports a comment into the moderator review queue with a full audit trail.
3Moderators
Active traders can apply to moderate a ticker they follow daily — the "Apply to mod" pill in that ticker's comment composer; each application covers that one symbol. Approved mods get scoped powers on their assigned tickers only: delete, pin, temporary bans (1h / 24h / 7d), and permanent ban within the ticker. Every action is logged with actor, timestamp, target, and reason.
4Guidelines & operator broadcasts
The Community Guidelines are part of signup — every new account agrees to them. Separately, the 247 desk can broadcast to your app in real time via the Pro Alert pill in the top bar, a full-width top-bar strip, or a system modal for critical announcements. Pro Alerts are a Pro / Elite tier feature.
Your desk, your data.
Notifications, support tickets, session management, and privacy controls — all reachable from the avatar at the bottom of the sidebar.
- Notification Settings (
Ctrl+Shift+N) — toasts, per-type sound chimes, poll interval, minimum change %, per-type filters, test button. - FlowBar Settings — the ⚙️ gear in the FlowBar header; five tabs covered in § 03.
- Support tickets — Help menu → Contact Support: subject, category, body, up to 5 screenshots (10 MB each). Real queue, real replies, ticket history in the same menu.
- Feedback — Help menu → Send Feedback for one-shot feature requests and ideas.
- Profile — the circular avatar at the bottom of the sidebar: email, tier badge (Free / Pro / Elite), password change, sign out.
- Active sessions — every device signed into your account with last-used time and client app. Sign out any single session, or everything except the one you're on.
- Download my data — a plain-text export of your personal data: email, tier, sessions, paper positions, comments, tickets. You own your data.
- Delete my account — a password-confirmed 3-step gate that permanently deletes everything. No tombstone rows; truly gone. Consider exporting first.
Every hotkey in the app.
| Action | Shortcut |
|---|---|
| Go to Dashboard | Ctrl + 1 |
| Go to MoBot Dashboard | Ctrl + 2 |
| Go to Charts | Ctrl + 3 |
| Go to News | Ctrl + 4 |
| Notification Settings | Ctrl + Shift + N |
| Position Sizer | Ctrl + Shift + P |
| Open DevTools | Ctrl + Shift + I |
| Reload app | Ctrl + R |
| Zoom in / out / reset | Ctrl + + / − / 0 |
| Fullscreen | F11 |
| Quit | Ctrl + Q |
The terms the app actually uses.
| Dollar Volume | Price × share volume — a better liquidity measure than raw share count. |
| Expectancy | Average P&L per trade: (Win% × Avg Win) − (Loss% × Avg Loss). Positive = profitable system. |
| Float | Shares available to the public for trading. Lower float = bigger moves on the same buying pressure. |
| Float Rotation | Intraday volume exceeding the entire float. 1× = every share traded once today; 2×+ usually means a runner. |
| Gap | Difference between today's open and yesterday's close — overnight news priced in. |
| L2 (Level 2) | The full order book: every price level with resting bid/ask quantity. L1 is just the best bid/ask. |
| Microfloat | Under 5 million shares in the float. Extreme volatility — a high-severity MoBot signal. |
| NBBO | National Best Bid and Offer — the tightest bid/ask across all US exchanges. |
| OTC | Over-the-Counter stocks outside NYSE/Nasdaq — pink sheets, OTCQB, OTCQX. Often sub-penny prices. |
| Profit Factor | Gross profits ÷ gross losses. Above 1 = profitable; above 2 = strong. |
| RVOL | Relative Volume — current volume vs the 30-day average for the same time of day. RVOL 5 = 5× normal. |
| Short Interest | Percentage of the float sold short. High SI + rising price = squeeze risk for shorts. |
| SIP | The consolidated US equities tape. Real-time SIP is a separate paid entitlement — without it, stock tick data is 15-min delayed. |
| Spread | Best ask minus best bid. Wider spread = less liquidity = more slippage. |
| Tick Rule | Trade-side inference: uptick = buy, downtick = sell. Used where the true aggressor isn't reported. |
| VWAP | Volume-Weighted Average Price — the #1 intraday anchor for institutional traders. Above = bullish, below = bearish. |
| Win Rate | % of trades that close profitable. A 40% win rate at 3:1 reward:risk beats 70% at 1:1. |
The questions we actually get, with actual answers.
The app isn't showing a new update — how do I update?
Why is my stock tick data delayed 15 minutes?
How much does 247Pro cost?
Is 247Pro on Mac? On Linux? On iPhone?
What makes a MoBot alert get the 🔥 heat icon?
What qualifies a symbol for Top Picks?
How does the Paper Trader Leaderboard stay fair?
Can I short on the Paper Desk?
Short in the Side dropdown when opening a position. P&L is computed correctly (price falls → you profit). No borrow rate is simulated.How do I export my Trade Journal?
Can I sync my watchlist across computers?
Does 247Pro connect to my broker?
Why is a specific OTC ticker not showing up?
How do I become a moderator?
Someone @mentioned me — where's the notification?
How do I report a bug?
How do I delete my account?
You've read the manual.
Now run the software.
Free for individual traders — stocks, OTC pinks, and 385+ crypto pairs on Windows, macOS, Linux, and iPhone. Sign in, build your watchlist, and start working a real edge.
Download 247MarketNews Pro →